Google Ads Performance Max campaigns offer a comprehensive way to combine different ad formats and channels to get the most out of your ad budget. But to fully exploit the potential of these campaigns, it’s essential to analyze and understand the data and results properly, and not just trust Google.
In this post, I’ll show you how to evaluate the performance of your Performance Max campaigns in detail to make important decisions. Let’s go.
Practice recommendation: The Insights tab was significantly upgraded in 2026. It’s worth including it as a weekly routine in your analysis workflow, not just ad-hoc when there are problems.
By the way: Click here for a detailed guide to Performance Max campaigns.
1. Examine campaign performance: How’s it going?
First, it’s important to get an impression of how the PMax campaign is currently functioning. Best to look directly at the graphs in the campaign overview.
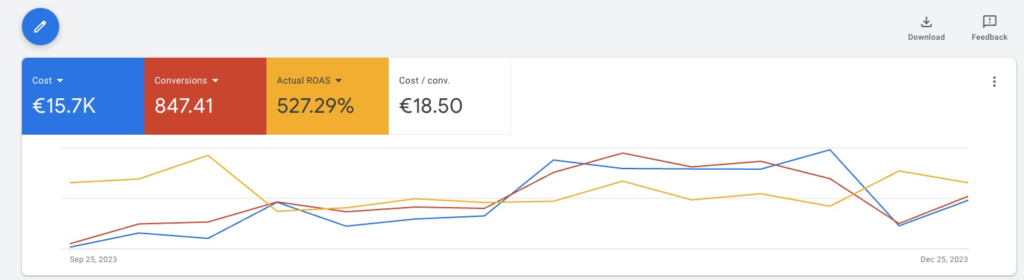
Select metrics specifically to examine correlations.
How do conversions behave when costs rise or fall? How does ROAS develop over time? Is the budget being used up?
You can answer all these questions directly via the overview.
Which metrics should you pay attention to?
The most important are the decisive metrics:
- Cost: How much budget have you invested?
- Conversions: How many sales or inquiries have you generated?
- Cost/Conversion: How much does a conversion cost you on average?
- ROAS or Conv. Value/Cost: How much revenue do you generate for every dollar invested?
There are also other metrics often considered:
- Impressions: How often were your ads displayed?
- Clicks: How often were your ads clicked?
- CTR (Click-through rate): How often are your ads clicked when shown?
- Avg. CPC (Cost per Click): How much does a click cost you on average?
Important: When you look at performance data of your campaigns, the time period is very important. Before making decisions, make sure it’s not just minor fluctuations. Always look at a longer period of at least 30 days and check long-term development.
Also note that it can often take 3-10 days for a conversion to be attributed to a click. For this reason, performance of the last days often looks worse than it actually is.
By the way: This article is mainly about how to evaluate the campaigns. If you want to learn more about the specific optimization steps, check out this post: Optimize PMax Campaigns.
2. Evaluate Asset Group Performance
Asset Groups are used to sensibly subdivide your campaign. With different texts, images, videos, and possibly products in combination with audience signals, you can pursue different approaches in one campaign.
In Google Ads, you can view and compare the performance of individual Asset Groups.
Access Asset Group reports, here’s how
To open the Asset Group reports, open your Performance Max campaign and navigate to Asset Groups in the left menu. By default, you see Asset Groups in the Summary view. For more detailed data, switch from Summary to Table view.
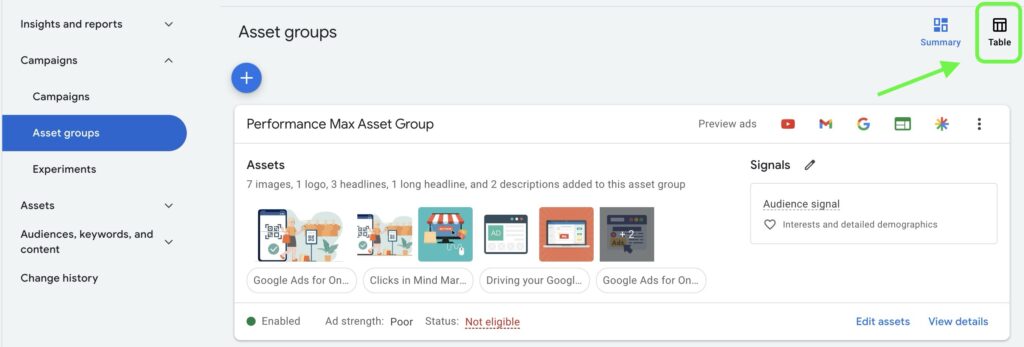
This way, all Asset Groups are displayed in rows.
Add relevant metrics to columns
By default, in the Table view, you won’t see data on clicks, conversions, or other metrics. You can easily change this by adjusting the columns.
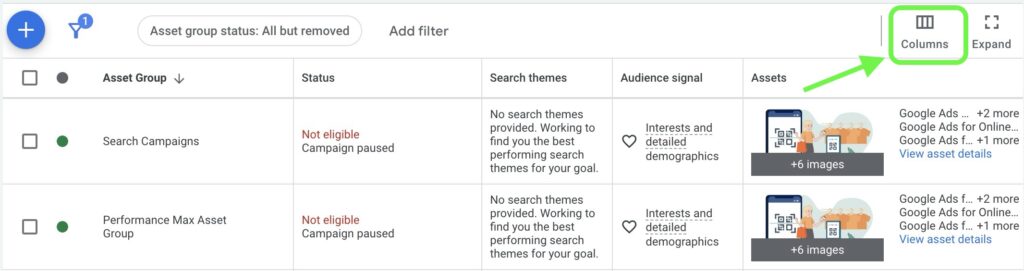
Click the column icon and select the metrics relevant to your analysis.
Asset-Group-level Search Terms Report
New since 2025/2026: You can now access the Search Terms report at the Asset Group level, not just the campaign level. This helps you when you run multiple Asset Groups in parallel, because you then see which search queries Google assigned per group.
Path: Open Asset Group → Insights → Search Terms.
Interpreting the data
After selecting the desired metrics, you get a detailed overview of the performance of your Asset Groups. Pay special attention to the following aspects:
- Top-performing groups: Identify the Asset Groups with the best conversion data. These groups provide valuable insights into what content and audiences work well. Also, make sure that most of the budget is used in these groups.
- Asset Groups with high costs and poor performance: Sort your Asset Groups by cost descending to see if your budget is being used correctly.
- Improvement potential: Identify Asset Groups that don’t generate many impressions, and investigate whether you can optimize or pause them.
3. Analysis of ad asset performance
Whether automated or not, in the end Performance Max campaigns are also about presenting users with text, display, or video ads. Whether users click or not depends mainly on your ad assets, the texts, images, and videos you can store in individual Asset Groups.
When the campaign has collected enough data, each asset receives a performance-based rating from Google.
Access asset detail reports
To analyze the performance of individual assets, open your Performance Max campaign and navigate to the Asset Groups. Click on a specific Asset Group and select „View Asset Details”.
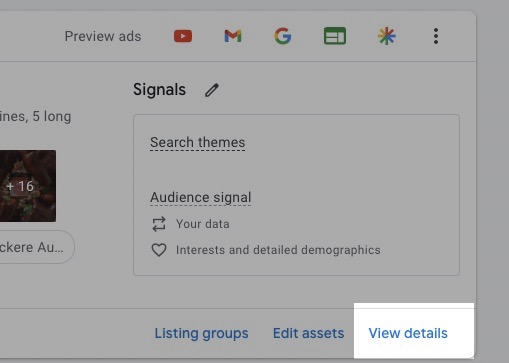
This takes you to a report showing the performance of each individual asset. In the Performance column, you’ll find a categorization of the assets.
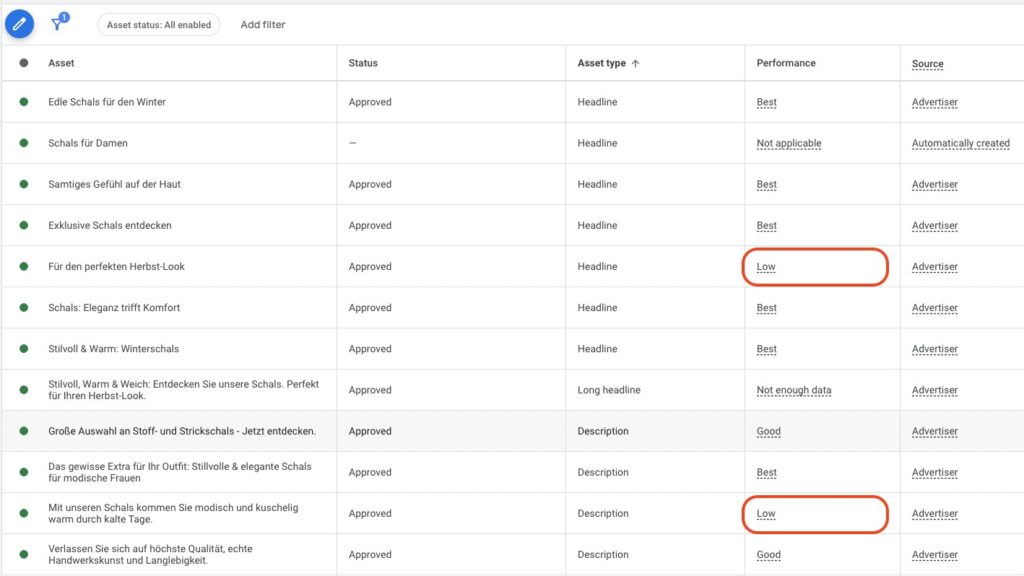
Google rates the performance of the assets in the following categories:
- Best: This asset performs best compared to others. It can also be that many or almost all assets are categorized as „Best”.
- Good: The asset performs adequately, but there are better ones.
- Low: The asset performs poorly compared to other assets of the same type in the Asset Group.
You may also find these values:
- Pending: Google doesn’t have enough data to rate an asset yet. There’s no exact info on how long this takes. For comparison: Responsive Search Ads need about 2,000 impressions for a rating.
- Not enough data: This value can also appear when a rating can’t yet be made. This can also be because there are too few assets for a comparison. When in doubt, add more assets.
- Not Applicable: Not all assets can be rated. This applies to HTML5, auto-generated, or rejected assets.
Optimizing the assets
Assets rated as „Low” should be replaced with new and optimized content. Assets with „Good” or „Best” ratings provide valuable insights into which content works well and can serve as a template for future optimizations.
Asset combinations
Use the asset combination report to identify the best combinations of your ad assets. This report shows which combinations perform best and helps you understand how the different elements work together.
For a more detailed guide to evaluating asset performance, read my detailed article PMax Asset Performance Analysis.
4. PMax Insights: Search categories and search terms
Once your campaign has collected enough data, you’ll find valuable information under Insights in Google Ads about the signals the Google algorithm discovered during the PMax learning phase.
The perhaps most important report is the one on search categories and search terms. You’ll usually find it as the third or fourth segment in Insights:
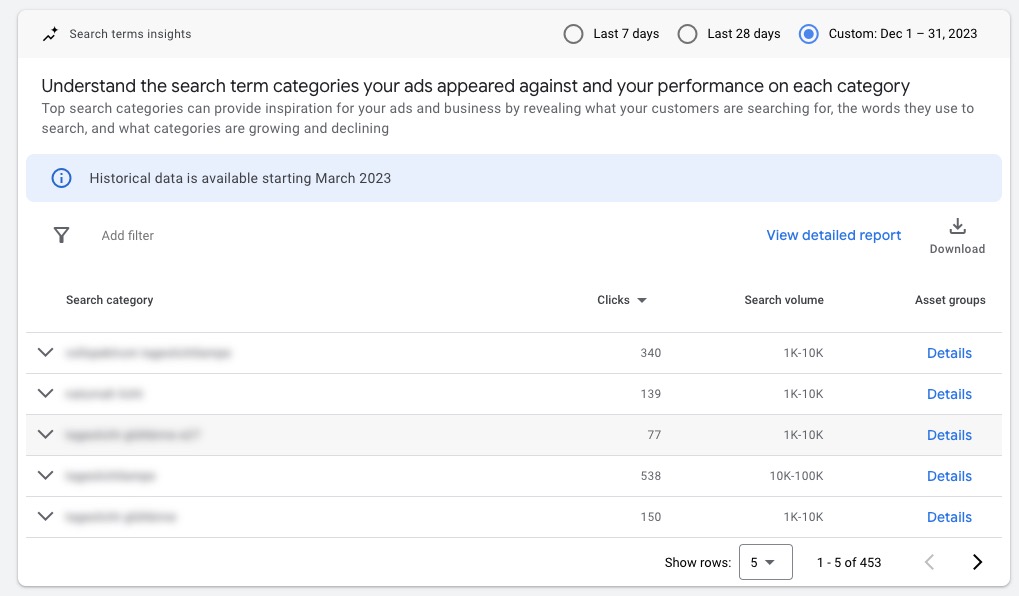
Here you can quickly and easily see which types of search queries generated the most impressions, clicks, conversions, or revenue.
More detailed analysis
Besides the first view, Google gives you several ways to analyze the search terms more deeply:
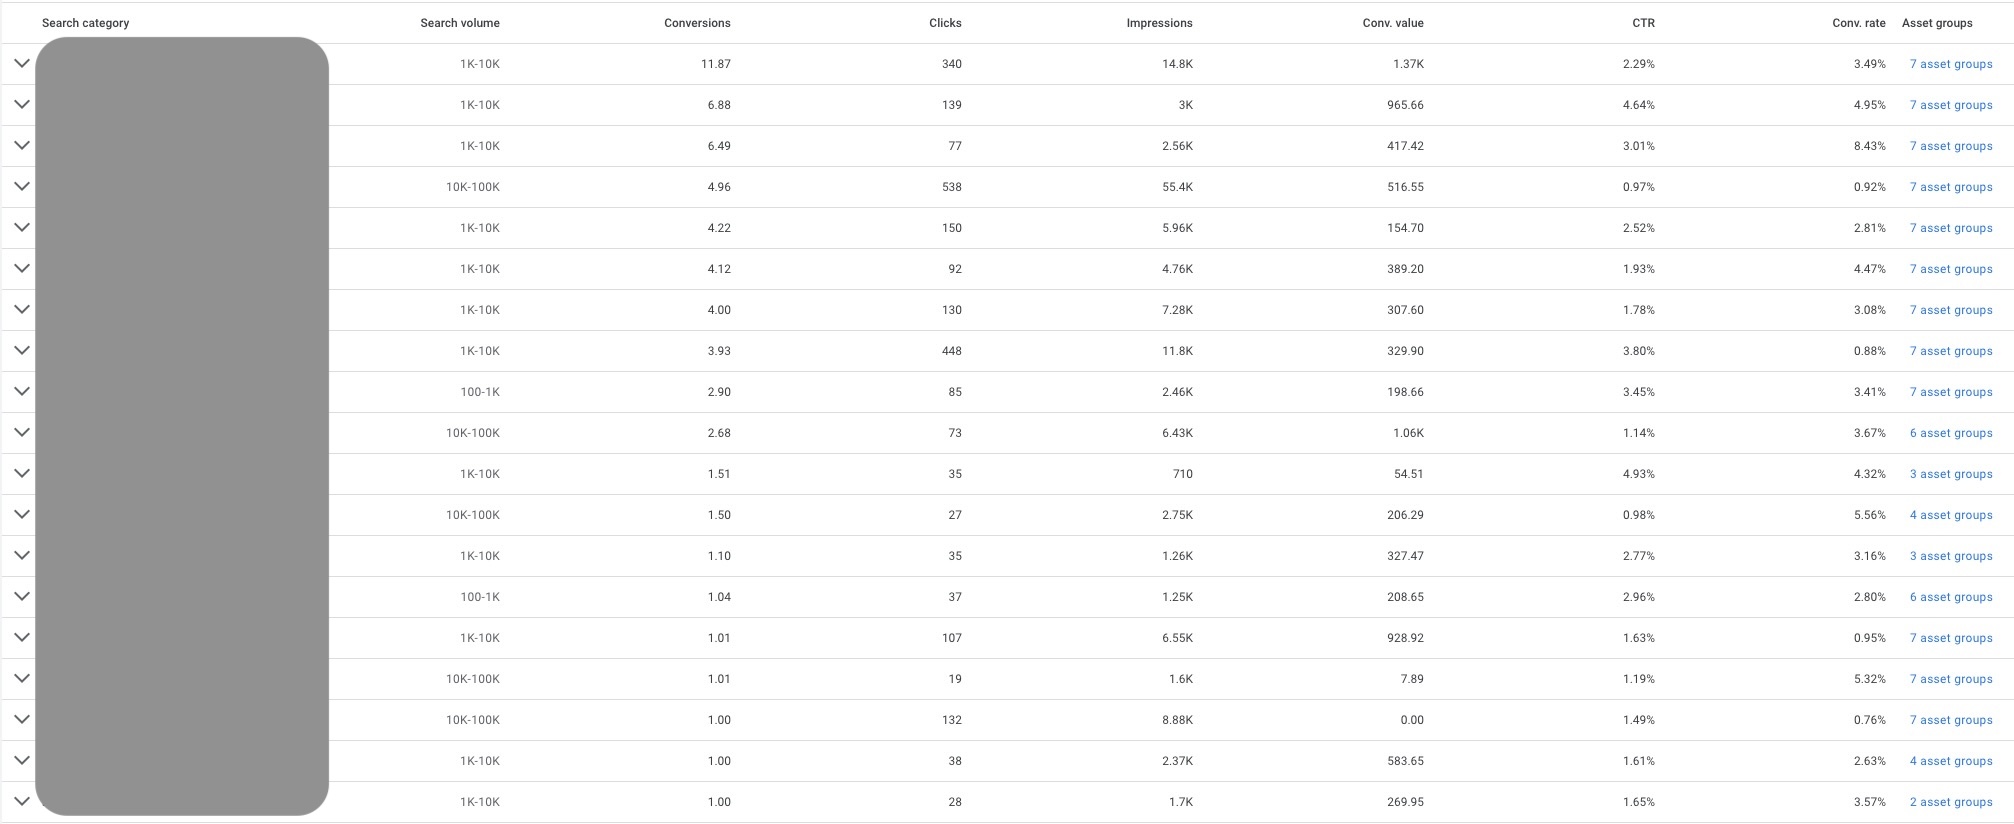
- Further subdivision of search categories: Clicking the arrow next to each search category gives you a more precise breakdown and the concrete search terms.
- Export data: You also have the option to export all data, so you can analyze it in Google Sheets, for example.
- Switch to detailed view: Via the blue link next to the download, there’s an even more detailed view in full size, where you can set columns as usual.

What should you pay attention to with search terms?
Unlike Search campaigns, you can’t directly control keywords and search terms with Performance Max campaigns.
You can only give the algorithm hints about which search queries are relevant for your ads, via ad assets, audience signals with search themes (now up to 50 per Asset Group), landing pages, and of course the product feed.
Based on these hints, the Google algorithm then tries to identify search categories that deliver the best performance, Performance Max indeed.
Sometimes that’s very interesting, other times it can also go in the wrong direction. So check the search categories for the following points:
- Brand terms: Performance Max campaigns are opportunistic. They will always take the easiest path to maximize performance. For this reason, you’ll often find your brand name among search categories. Brand searches naturally promise a much higher probability of conversion. In most cases, that’s not in your interest. My clear recommendation in this case is to exclude your brand in campaign settings. More on this here: Excluding brand keywords from PMax campaigns.
- Unknown terms that work well: Check if there are search terms that have already generated conversions but that you didn’t have on your radar. These are valuable insights. Add these search terms as keywords and also as search themes to the campaign.
- Irrelevant terms: If you find many terms that don’t perform well and aren’t really relevant to your offer, it’s a hint that Google received wrong signals. Check your campaign setup again in this case. Since end of 2025, you can directly manage negative keywords in the PMax campaign (up to 10,000 per campaign), more in the article PMax Negative Keywords.
Du willst mehr Erfolg mit Google Ads?
Hol dir einen kostenlosen Google Ads Reality Check: ein kompaktes Video (ca. 10 Minuten), in dem ich dir zeige, wo in deinem Konto Budget liegen bleibt – und was du ändern solltest.
Google Ads Reality Check erhalten →
5. PMax Insights: Valuable insights through audience reports
When your campaign has already collected enough data, you’ll find in Insights the audiences that generated disproportionately many impressions, clicks, or conversions. In short: the audiences that respond above-average to your ads.
Looking into this report is often very revealing. Because in many cases, Google focuses on completely different audiences than those you’ve stored as audience signals.
What are audience signals?
Audience signals are hints you give Google to optimize the targeting of your ads.
More details in my article Performance Max Audience Signals.
How to find audience insights
Navigate to the Insights area in your campaign. You usually find the audience section when scrolling all the way down.
What can you do with the data?
First, it’s interesting to see which well-performing audiences the Google algorithm has identified. Often there are some you wouldn’t have thought of directly.
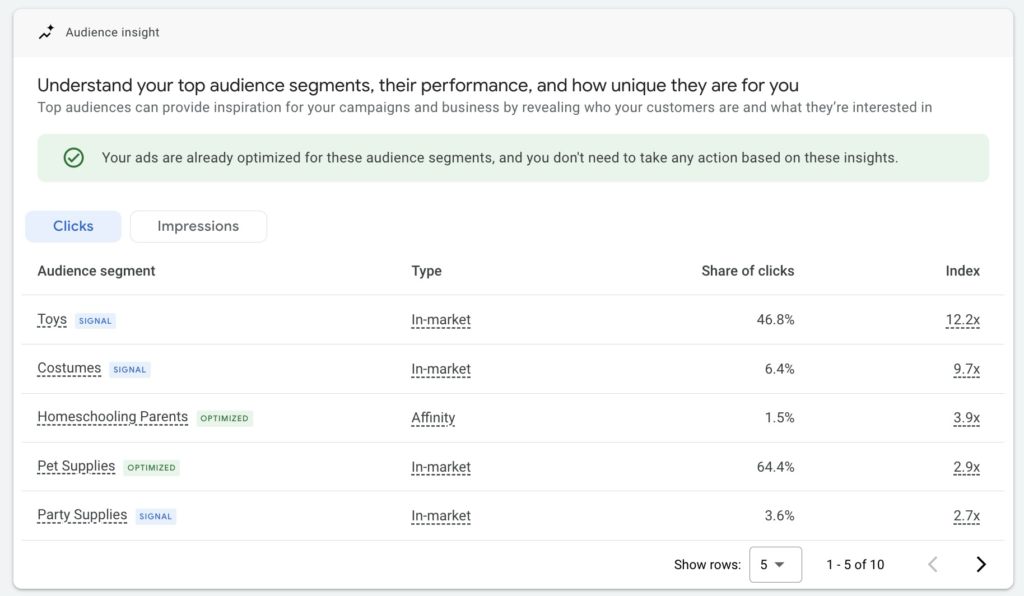
In this evaluation, look for audience segments that perform well but haven’t yet been added to the campaign as a signal. You can tell if that’s the case by the marking next to the audience:
- Signal (Blue): This audience is already used as a signal.
- Optimized (Green): This audience was identified by the algorithm and works well.
If you find new audiences in your evaluation that work particularly well, add them to the campaign as an audience signal. This increases the chance that the algorithm will focus even more on high-performing audiences.
Demographic depth
The Audience Report now offers breakdowns by age, gender, income, education, and geo data. This lets you check hypotheses about whether, for example, your PMax campaign primarily delivers to a different audience than what you stored in the signals.
Looking into the audience report can also be exciting for other campaigns. You could add them as observation audiences to your Search campaigns to see if they also work above-average there.
6. Channel Performance Report: Where does your budget actually go?
Since mid-2025, there’s the Channel Performance Report in the PMax Insights tab. It’s Google’s native answer to the legitimate question „Which channel eats my budget?”.
Path: Campaigns → Select PMax campaign → Insights → Channel Performance.
The report shows you per network:
- Impressions
- Clicks
- Conversions
- Costs
- Percentage distribution
This lets you see at a glance whether the budget flows where it converts, or whether, for example, Display gets disproportionately much spend without performance.
Practical: If you run a Feed-Only PMax campaign, you can verify here whether it really primarily serves Shopping.
7. Check Auction Insights
Besides analyzing your audiences and search categories, it’s just as important to know who you’re competing against in Google Ads. The Auction Statistics report provides valuable insights into the competitive environment and lets you compare your presence with that of your competitors.
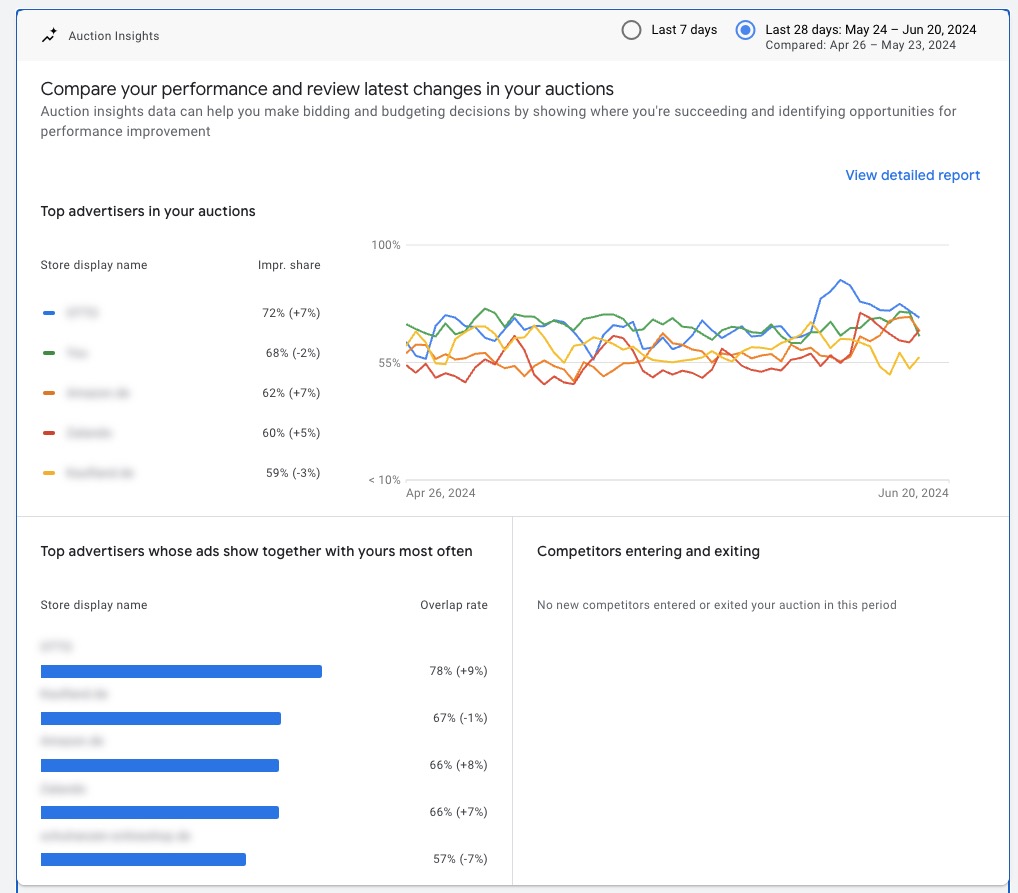
In this report, you can set specific date ranges to see how your share of search impressions changes over time. This is especially important because adjustments to your assets can influence the relevance of your ads for important search queries.
With Auction Statistics, you get a better understanding of your competition and can adjust your ads, bidding strategies, and budgets accordingly.
Important: This report is often not available for campaigns with smaller budgets. Google only shows it from a search impression share of over 10 percent.
8. Evaluate product reports and Listing Groups (for e-commerce)
PMax campaigns have established themselves especially in e-commerce. They are the evolution of Smart Shopping campaigns, which have been gone since 2022.
When a product feed is stored in a PMax campaign, it mostly runs Shopping Ads.
Since Shopping Ads basically just use data from the product feed, you can only marginally influence the ads.
With a well-maintained feed and a sensible breakdown into product groups via Listing Groups, however, you can control the quality and relevance of the ads well.
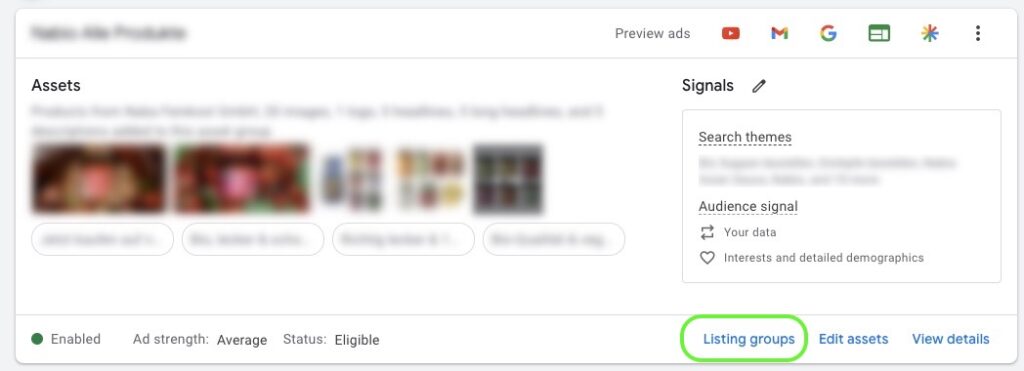
Analyze Listing Groups
Via Listing Groups, you can select the products or product groups to be advertised for each Asset Group.
In Google Ads, you can analyze the performance of the associated Listing Groups for each Asset Group.
Just navigate to the Asset Group overview and click on Listing Groups to open the report:
In the Listing Group view, you can evaluate data for individual products or product groups in a table view as usual.
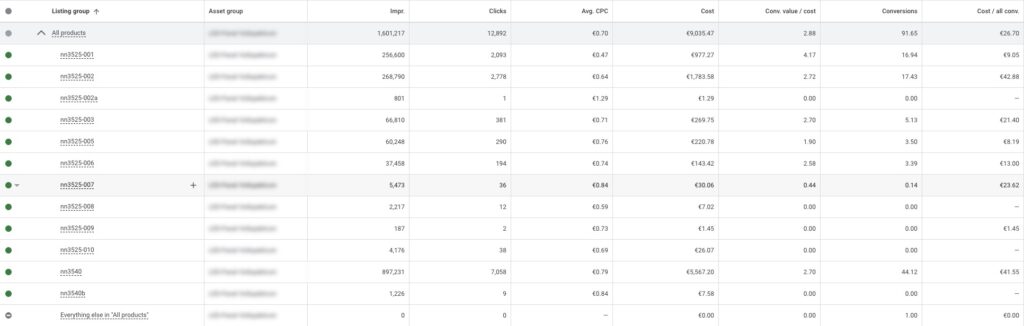
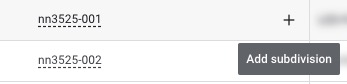
Tip: If you didn’t directly use product IDs in Listing Groups, but an attribute like brand, category, or product type, you can subdivide each row further. To do that, hover over an entry with the mouse and click the plus.
Evaluate product performance
Listing Groups only give you an impression of performance within individual Asset Groups.
If you want to evaluate cross-campaign or even cross-account how individual products or product groups work, you can do that via the product reports in Google Ads or directly in Google Merchant Center.
To additionally cross-check the PMax data outside of Google Ads, I like to pull in a second data source and analyze the Google Ads reports in GA4.
Product report in Google Ads
You find the product reports under Campaigns in the left sidebar. There you can look at the performance of products, categories, brands, product types, and custom labels.
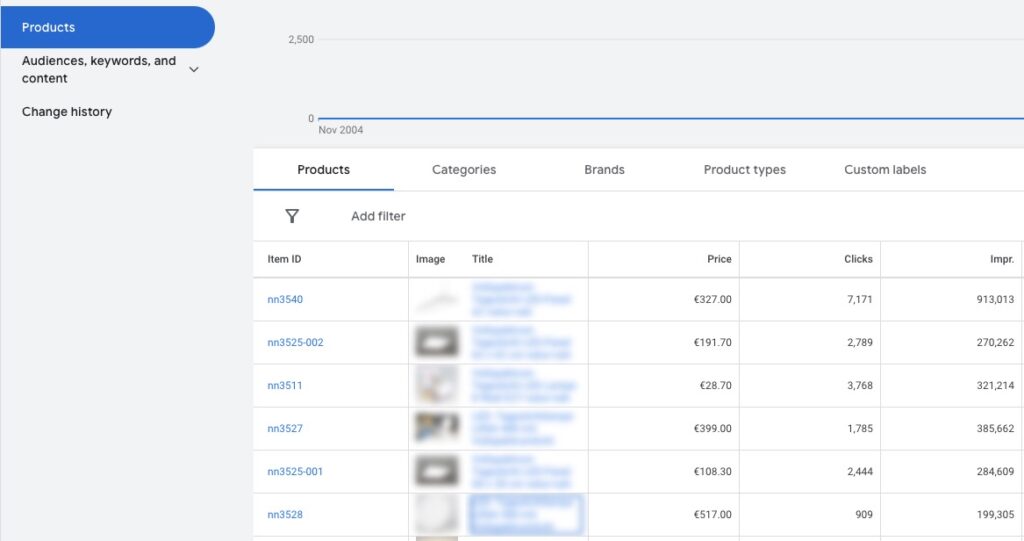
Additionally, there’s also a tab for diagnostics. There status messages and problems with the products are displayed.
Now to the hidden reports
Besides the reports you find directly in Google Ads, I want to show you 3 more options that are hidden. For these, you have to set up a Custom Report or use a script.
9. Insight into PMax placements
Since they serve across the entire Google network, with Performance Max campaigns you often wonder where the ads are actually placed.
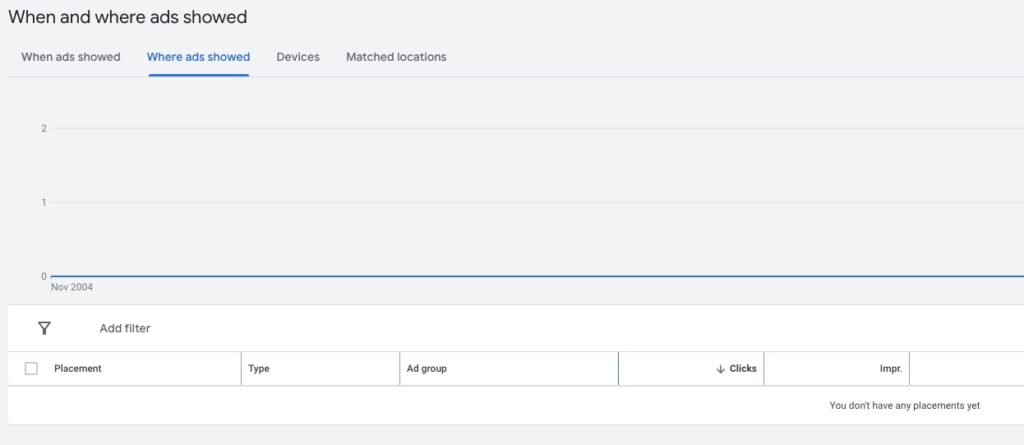
There’s a report under the menu item „When and where were ads shown?”. But it doesn’t show you any data.
Set up Custom Report for placement evaluation
There’s a way to view the placements of your campaign: Custom Reports.
There’s even a ready-made template.
Just navigate to the Report Editor:
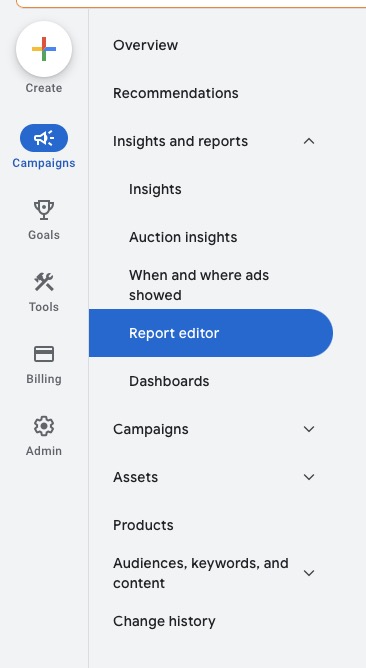
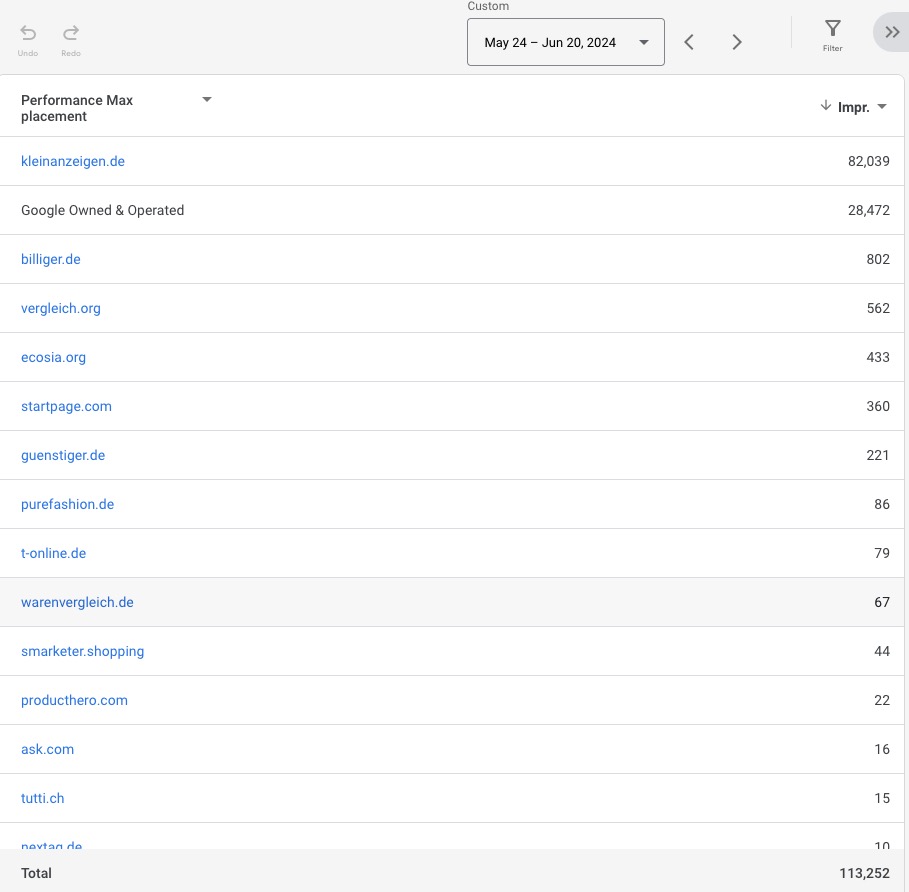
When you scroll down a bit, you should find the ready-made report „Performance Max campaigns placement”.
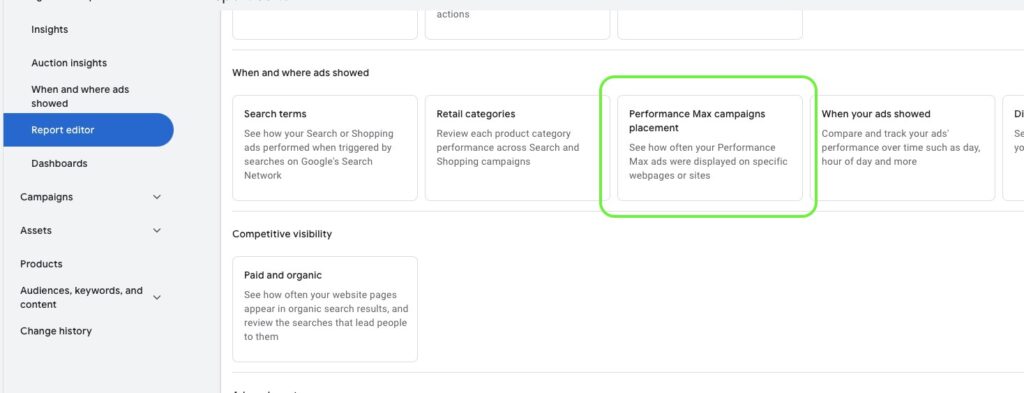
When you click on it, you get an overview of your ad impressions on other websites. In this case, it’s mainly about Display ads.
10. Create PMax landing page report
The reporting functions for PMax campaigns are constantly evolving. While in the beginning, landing page evaluation was only possible via Google Analytics, you can now create a custom report in Google Ads for that.
Here’s how to create the report
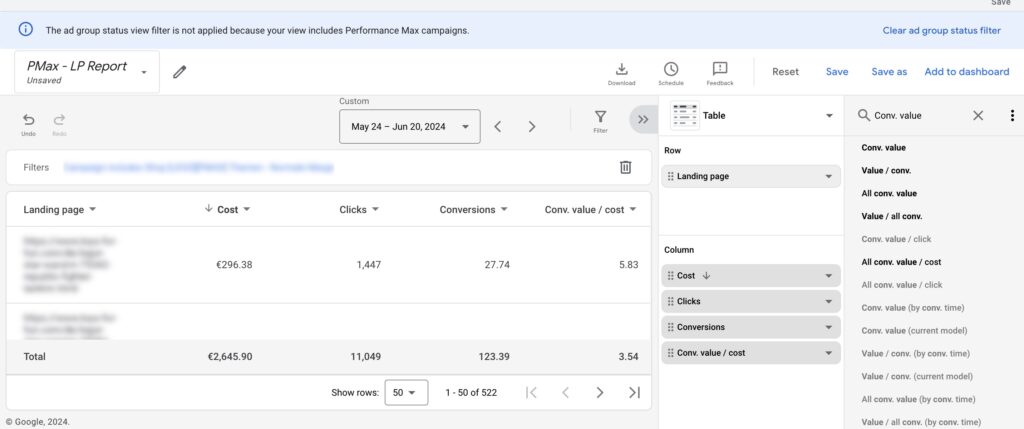
- Navigate to Custom Reports.
- Create a new report via the blue button.

- Configure the report: Add two row dimensions to your report: „Campaign” and „Landing page”. Then add column metrics like Clicks, Impressions, CTR, Conversion Rate, Conversions, ROAS, and Conv. Value. To filter the report on a specific Performance Max campaign, click „Filter” in the top right, select your Performance Max campaign, and click „Apply”. The resulting view shows you performance metrics for each landing page associated with the selected campaign.
Tip: If you identify pages causing problems, you can exclude them from your Performance Max campaign. Use the data gained to identify problematic pages and add them to the landing page exclusions in campaign settings.
11. More depth with PMax scripts
Performance Max (PMax) campaigns can seem like a black box because it was often unclear in which Google network most impressions are generated. With the Channel Performance Report since 2025, that has significantly eased. For even deeper analyses, there are Google Ads scripts.
Scripts in Google Ads
Scripts in Google Ads are small JavaScript programs that enable automation of routine tasks and can perform in-depth analyses in your Google Ads account.
Mike Rhodes’ PMax Script
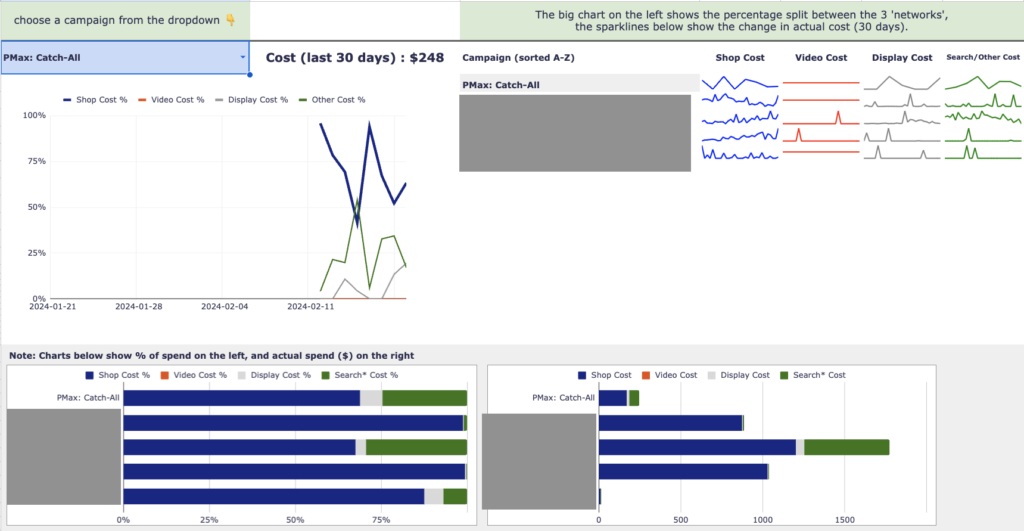
A useful tool for PMax campaigns is Mike Rhodes’ script, available on GitHub. This script generates an automatically updated report in Google Sheets that provides valuable insights into your PMax campaign:
- Distribution analysis: See exactly where your ads are served within the Google network.
- Asset group performance: Detailed information on the performance of individual asset groups.
- Product performance: See at a glance which products are running well and which aren’t used at all.
- Search term analysis: Clear overview of the search terms associated with your ads.
More options in the article 10 super helpful PMax scripts.
Conclusion: A look into the black box
Even if Performance Max campaigns may seem like a black box at first glance, they offer numerous valuable data points that can help you understand their workings better.
With the 2025/2026 updates (Channel Performance Report, Asset-Group-level Search Terms, expanded audience depth), Google has addressed many of the original black-box pain points. The scripts supplement that with additional depth.
When you know where and how to search, you can gain detailed insights into audiences, search categories, competitors, and landing pages.
This information is crucial to optimizing your campaigns and achieving the best possible results. Use the available reports and insights to leverage the full performance of your Performance Max campaigns.
I hope I could help you with this article and wish you success with your campaigns.
Work smart with Clicks in Mind
You might also like
 Performance Max
 Negative Keywords for PMax: How to Use Them Right
Add negative keywords directly to PMax, up to 10,000 per campaign. How to use the feature optimally for Search and Shopping ads.
Read more → Performance Max
 Analyze PMax Asset Performance: How to Do It in Google Ads
Here you learn where to find PMax asset evaluation, how to use Asset-Group-level Search Terms, and how to pull hard performance data with the Asset Auditor.
Read more → Performance Max
 What is a Catch-All Campaign in Google Ads? (+ Strategies)
Catch-All campaigns in Google Ads explained: strategies, pros and cons, Channel Distribution check, Negative Keywords hygiene, and cross-link to Feed-Only PMax.
Read more →You want more results with Google Ads?
Get a free Google Ads Reality Check: a compact video (about 10 minutes) showing where budget is slipping away in your account and what to change.
Get your Google Ads Reality Check